Introduction
New York Mortgage Trust (NASDAQ:NYMT) had an “as expected” quarter with only a small drop in book value compared to my expectations. The company kept buying mortgage-backed securities but in smaller amounts than last quarter. Overall, NYMT is slowly improving and is currently in our hold range.
Commentary
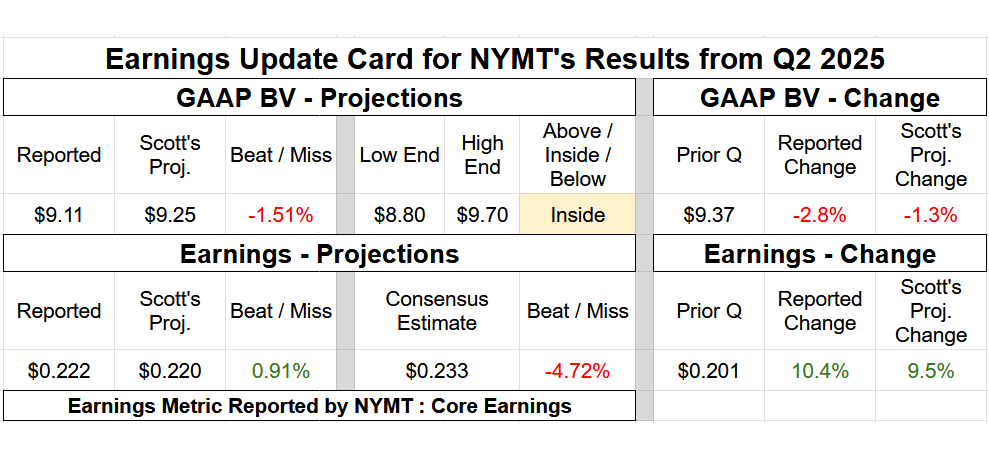
- Quarterly BV Fluctuation: Minor Underperformance (1.5% Variance).
- Core Earnings/EAD: Basically an Exact Match (Only a $0.002 Variance).
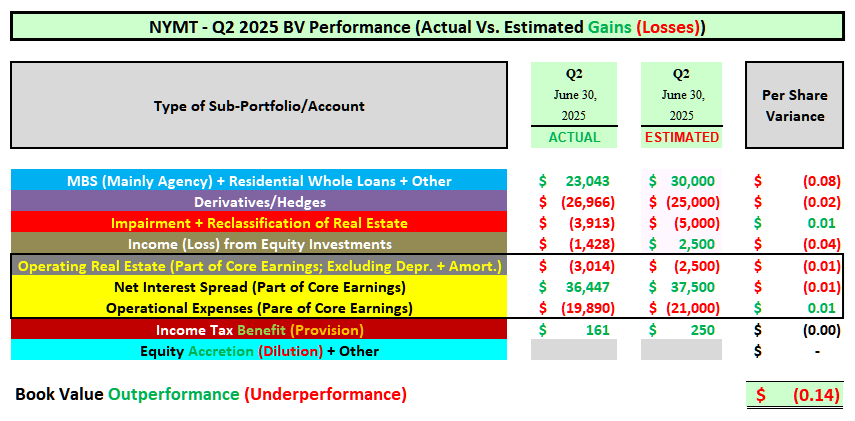
A largely “as expected” quarter regarding New York Mortgage Trust’s BV in my opinion. If anything, a minor underperformance. NYMT recorded a minor quarterly BV decrease versus my expectations of a very minor – minor decrease. Let us briefly discuss how NYMT’s sub-portfolios performed when compared to my expectations.
First, NYMT continued to purchase fixed-rate agency MBS during Q2 2025. This was even after purchasing $4.4 billion of fixed-rate agency MBS over the prior 7 quarters. As stated within last quarter’s earnings conference call, even after rapid expansion, management remained “bullish” on agency MBS and basically stated they would continue to increase this sub-portfolio over the foreseeable future. Taking that as a cue, while I correctly projected NYMT would continue to purchase fixed-rate agency MBS during Q2 2025, actual volume was slightly smaller-than-anticipated. For example, NYMT purchased $1.5 billion and $504 million of agency MBS during Q1 2025 and Q2 2025, respectively. While still a respectable increase during Q2 2025, a pretty large pullback versus Q1 2025 purchase volume. In comparison, I projected Q2 2025 agency MBS purchases of $750 million which was still a projected (50%) versus Q1 2025 purchase volume. Since fixed-rate agency MBS pricing quickly increased during late June 2025, any additional purchases would have resulted in larger valuation gains (hence BV net gains) during the quarter (even when assuming additional derivative instruments would have also been added; overall spread/basis risk declined late in the quarter). In addition, NYMT purchased/funded $397 and $280 million of new residential whole loans during Q1 2025 and Q2 2025, respectively. This basically matched my projection of $300 million during Q2 2025. So, NYMT’s smaller-than-anticipated agency MBS purchases directly led to a minor underperformance within NYMT’s MBS/investment valuation fluctuations when compared to my expectations (see BV table below; 1st row of accounts).
Second, NYMT’s hedging/derivative instruments largely matched my expectations from a BV perspective during Q2 2025. If anything, a very minor underperformance. Since NYMT has yet to provide the company’s 10-Q report (no derivative details in the company’s earnings press release other than valuation fluctuations), I cannot reconcile this specific account yet. However, I am not too concerned by the near matching of this account’s net valuation loss (see BV table below; 2nd row of accounts).
Third, for the 2nd straight quarter, NYMT recorded fractionally less severe impairments/write-downs during Q2 2025 when compared to my expectations (see BV table below; 3rd row of accounts). NYMT has continued to record notably better results within this account (less severe impairments/write-downs) versus late 2023 – parts of 2024.
Fourth, nothing too surprising/alarming within NYMT’s income earned from the company’s equity investments as well. If anything, a minor underperformance (see BV table below; 4th row of accounts). That said, after the turmoil within this sub-portfolio during 2023 – early 2024, the bar was fairly recently set notably lower. As a refresher, NYMT has continued to try and actively reduce the company’s equity exposure of multi-family properties through the company’s various JV agreements and real estate investments. Unlike earlier in 2024, this strategy finally picked up during Q3 – Q4 2024 as parts of the commercial real estate market slowly “began to thaw”. Simply put, the gap between buyers and sellers narrowed enough, with a bit more credit support from mainly non-bank financial institutions/market participants, to begin to pick up transactional volume during the latter-half of 2024. This generalized trend continued during Q1 2025 but market volatility around the tariff announcement in early April 2025 caused a reduction in activity during Q2 2025. In a nutshell, NYMT’s largely multi-family investments are continuing to be gradually “off-loaded” but recently the pace has slowed again. However, unlike prior quarters when the “higher quality” properties were sold, now NYMT is likely getting into the less desirable properties within their sub-portfolio. For example, NYMT recorded a total net realized loss of ($41) million during Q1 2025. A portion of this loss was attributable to this specific sub-portfolio. That said, most of this said loss was already previously reserved for in prior quarters (simply an unrealized to realized loss reclassification). Again, there was minimal realized activity that occurred during Q2 2025.
Fifth, unlike the prior several quarters, NYMT’s real estate net operating metrics were fractionally more negative during Q2 2025 when compared to Q1 2025. A fractionally worse performance (more severe net loss) when compared to my expectations but nothing alarming at this point (see BV table below; 5th row of accounts). Still considerable net improvement within this sub-portfolio when compared to late 2023 – 2024. However, similar to the prior quarter, sales basically did not occur within this specific sub-portfolio during Q2 2025 either. Again, I believe market volatility around the tariff announcement in early April 2025 caused a reduction in activity during Q2 2025.
Finally, NYMT’s income tax (provision)/benefit account basically matched my expectations (see BV table below; 8th row of accounts).
Moving on, for the 1st time in years, NYMT finally began providing the company’s core earnings/EAD metric again starting in Q1 2025. As noted last quarter, this was a surprise at the time and welcome addition. NYMT’s core earnings/EAD basically matched my expectations during Q2 2025 (a minor increase when compared to Q1 2025). Still, let us briefly discuss the main factors that comprise this metric.
First, when reviewing net interest spreads (which excludes unrealized and realized valuation gains/losses), NYMT reported a modest increase in interest income which was only partially offset by a minor – modest increase in interest expense. This resulted in a minor increase in quarterly net interest spread income. With the slightly lower combined amount of fixed-rate agency MBS and residential whole loan purchased/funded during Q2 2025 versus my expectations (as noted above), this simply resulted in a slightly smaller increase in NYMT’s net interest spread income (see BV table below; 6th row of accounts). Second, this was basically fully offset by a slightly larger-than-anticipated decrease in NYMT’s operational expenses when excluding any debt issuance costs which are reversed out of core earnings/EAD (see BV table below; 7th row of accounts).
So, I believe NYMT reported an average – fairly decent quarter overall. NYMT’s minor quarterly BV decrease should underperform a majority of the company’s hybrid mREIT sub-sector peers. However, I would point out NYMT’s investment portfolio is now 50% agency MBS. When compared to the agency mREIT peers, the severity of NYMT’s quarterly BV decrease looks fairly decent. NYMT’s minor quarterly increase in core earnings/EAD is a continued step in the right direction (which was already correctly projected on my end).
I will be pleased if/when NYMT continues to unload some real estate/JV equity multifamily assets in the coming quarters. A good chunk of these assets are generating very low – low levered returns.
As such, I continue to believe a risk/performance rating of 4.5 for NYMT remains appropriate in the current environment/over the foreseeable future. That said, with last quarter’s upgrade, NYMT has technically moved a bit “closer” to a risk/performance rating of 4 (not there yet though).
BV Performance (Actual Vs. Estimated)
The REIT Forum
Change or Maintain
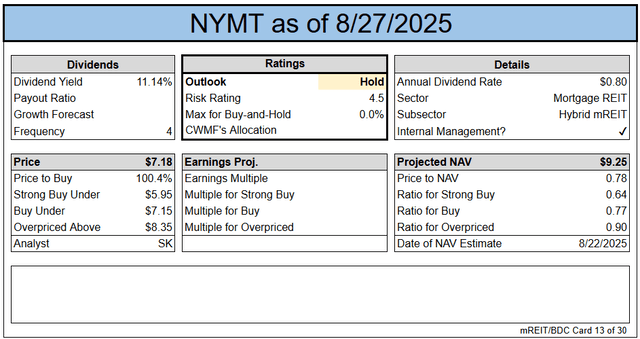
- BV/NAV Adjustment (BV/NAV Used Interchangeably): Our projection for current BV/NAV per share was adjusted: Down ($0.15) (To Account for the Actual 6/30/2025 BV/NAV Vs. Prior Projection). Price targets have already been adjusted to reflect the change in BV/NAV. The update is included in the card below and the subscriber spreadsheets.
- Percentage Recommendation Range (Relative to CURRENT BV/NAV): No Change.
- Risk/Performance Rating: No Change. Remains at 4.5.
Earnings Results
The REIT Forum
Note: BV at the end of the quarter. Subscriber spreadsheets and targets use current estimates, not trailing values.
Valuation
The REIT Forum
Ending Notes/Commentary
As correctly stated in many prior assessment articles, NYMT’s multifamily JV equity interests will continue to be a “drag” during 2024 – 2025 (will alleviate over time though). This is not a new event. Remember, NYMT has equity interests in these positions when considering credit hierarchy. This has (and will) result in a more severe, permanent loss in BV/capital when compared to first (or even second) lien debt investments if market conditions remain depressed (or deteriorate further). Simply put, not a good situation but, again, this is already factored in my/our risk/performance ratings. This has been something that has been discussed for the past 10 quarters. That said, by now most of these eventual realized losses are already reserved for. This notion only solidifies why I/we previously had NYMT assigned a risk/performance rating of 5 (underperforming peer) back in parts of 2023 – 2024. However, as this particular market began to “unfreeze”, along with the recent quick investment shift into agency MBS and residential whole loans (less risky), I/we upgraded NYMT to a risk/performance rating of 4.5 back in September 2024.
Continued progress and improving performance metrics could eventually lead to another upgrade to a risk/performance rating of 4 (as early as later this year).
Remember, I/we continue to have NYMT priced at a discount to the company’s better-run sub-sector peers. Even though NYMT has recently acquired fixed-rate agency MBS, the remaining composition of the company’s investment portfolio is still riskier than some sub-sector peers. One also has to consider the GAAP impacts of NYMT’s consolidated VIEs and mortgage-related equity investments (as discussed in the past).
I/we continue to believe an investment in NYMT’s common stock is a “speculative – very speculative” play. Simply put, not a great “fit” for your cautious – semi-cautious investor. It will continue to take time for NYMT to “right the ship” via continuing to rotate out of risky/underperforming investments (and recording proportionately large realized losses) into residential whole loans (which still have credit risk) and agency MBS (which have interest rate/prepayment risk and need hedges which currently have notably less attractive terms). For investors with a high – very high risk tolerance and long-term time horizon, NYMT could be on one’s “radar”.
Read the full article here


